TrademarkTrademark
服务
学习
公司
IQON App
July 19·Updated July 20

Game Overlay and Graph Overlay Explained

TL;DR
IQON includes two customizable overlays for monitoring your PC and games in real time. The Game Overlay presents compact live values and status indicators, while the Graph Overlay plots metrics over time so spikes and trends are easier to see. Both use IQON's universal overlay system, work across games without depending on a specific graphics API, and can also be displayed on the Windows desktop.
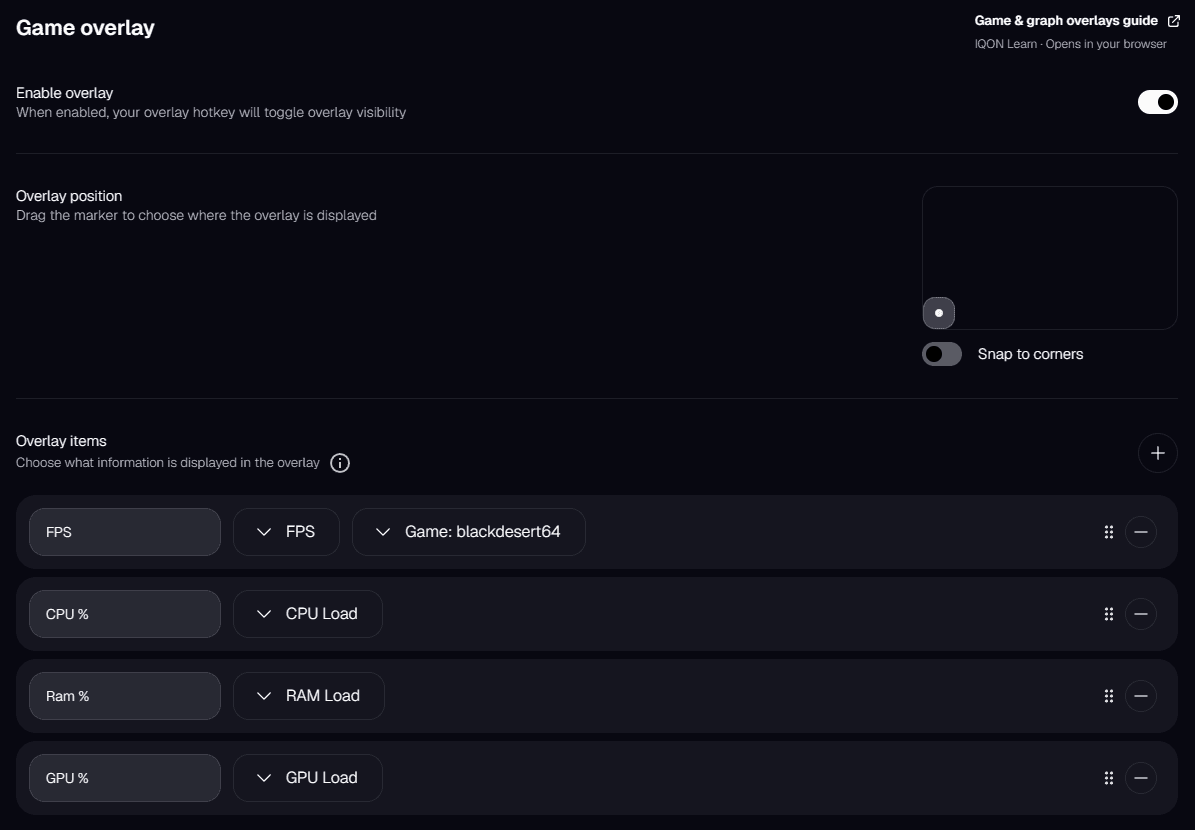
IQON ships two overlays: the Game Overlay floats real-time telemetry on top of your game, and the Graph Overlay plots that same telemetry over time so you can spot trends. Both are universally compatible - they hook into the Windows rendering stack rather than per-game APIs, so they work in any title and even on the Windows desktop with no integration required.The Game Overlay is the compact heads-up display. It renders a small, configurable panel of live values on top of whatever you are playing, so you can keep an eye on the metrics that matter without alt-tabbing. Position, opacity, and which readings appear are all customizable, and the overlay stays out of the way in fullscreen, borderless, or windowed modes.The Graph Overlay shows the same metrics as line charts over a rolling time window. Where the Game Overlay answers "what is happening right now", the Graph Overlay answers "what just spiked". It is the fastest way to correlate a frame drop, stutter, or latency spike with a specific sensor reading - for example, watching GPU temperature climb alongside falling framerate during a long session.Both overlays pull from the same set of data sources, so anything you can see live you can also graph. Most sources are standard hardware sensors exposed through Windows and your GPU driver:
  • CPU usage, per-core clock and load, package temperature
  • GPU usage, clock, temperature, VRAM, and power draw
  • RAM and pagefile utilization
  • Framerate, frametime, and 1% low / 0.1% low percentiles
  • Storage activity and temperatures
Game FPS is captured per-frame directly from the render queue rather than estimated. This is what makes the frametime graph and the 1% low / 0.1% low readouts meaningful - they reflect the actual cadence of presented frames, not an average. If you see a solid 60 FPS average but spiky frametimes, the Graph Overlay will show exactly when and how badly frames were dropped.Black Desert Online is a special case. IQON parses BDO's actual network packets to measure round-trip latency to the game server, which is far more accurate than a generic ICMP ping to the server IP - BDO's traffic is routed and prioritized differently than ping, and the game server may not even respond to ICMP at all. BDO latency appears as its own data source in both overlays whenever IQON detects the game running, so you can watch it climb during congested periods or correlate lag spikes with framerate hitches.Both overlays work everywhere. IQON renders through the Windows Desktop Window Manager, not a specific graphics API, so there is no per-game hook and no dependence on DirectX, Vulkan, or OpenGL being present. That means the overlay appears in:
  • Any PC game, fullscreen or windowed
  • Emulators and older titles
  • On the Windows desktop itself, with no game running
Desktop mode is useful on its own - you can leave the overlay pinned while benchmarking, video encoding, or just keeping an eye on thermals during heavy background work. Because the overlay is not tied to a game process, it keeps running when you quit a title, so there is no gap in coverage when you swap between games or back to Windows.Use the Game Overlay when you want a glanceable summary during play - framerate, GPU temp, the handful of numbers you actually care about. Switch to the Graph Overlay when something went wrong and you need to understand what - a stutter, a latency spike, or a slow thermal drift over a long session. They are most powerful together: glance at the live values, then expand the graph to see the story behind them.