TrademarkTrademark
Послуги
Дізнатися
Компанія
IQON App
July 19·Updated August 5

Game Overlay and Graph Overlay

TL;DR
IQON’s Game Overlay and Graph Overlay put live PC and game telemetry on screen while you play. The Game Overlay shows compact values and status indicators; the Graph Overlay plots the same sensors over time so spikes and trends are easy to spot. Both work across games and on the Windows desktop — no per-game graphics API hook required.
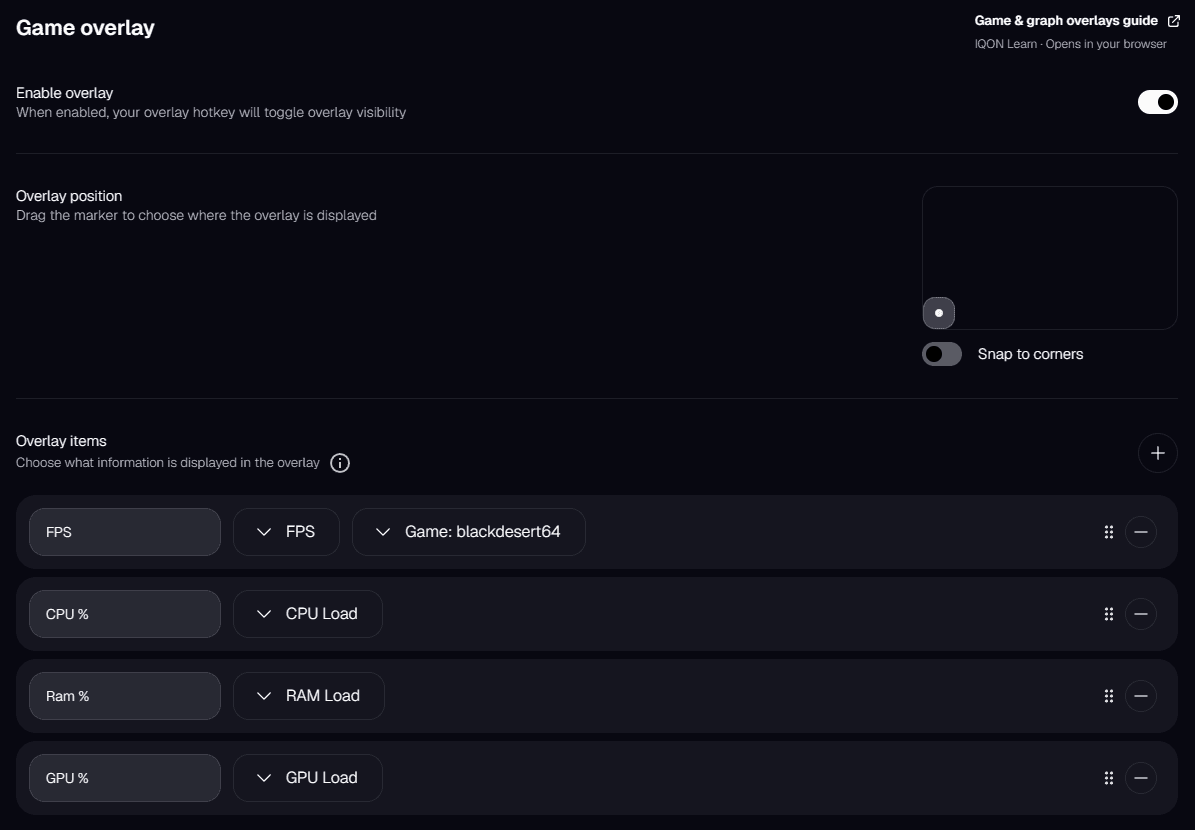
IQON ships two overlays for watching your PC and games in real time. The Game Overlay is a compact heads-up panel of live values and status indicators. The Graph Overlay plots those metrics as charts over a rolling window so you can see spikes, stutters, and thermal drift as they happen. Both use IQON’s universal overlay system — they render through Windows rather than a specific game graphics API — so they work in any title and on the desktop with no per-game integration.Find them in the IQON app under More → Game Overlay and More → Graph Overlay. Each screen has its own enable switch, hotkey, monitor, layout, and list of overlay items.The Game Overlay is the glanceable HUD. Use it when you want a small set of numbers or status badges on top of the game without alt-tabbing.
  • Open More → Game Overlay.
  • Turn on Enable overlay. When enabled, your overlay hotkey toggles visibility.
  • Set the hotkey (if you want something other than the default).
  • Pick the monitor and corner (or fine-tune position) so the panel sits where you expect.
  • Choose a style preset — Default, Minimal, Colorful, or Custom — and adjust background/font colors and font size if you use Custom.
Overlay items control what appears in the live panel, and in what order. Add an item, pick a data source, optionally rename the label, and drag to reorder. The list order is the order you see in-game.Available Game Overlay data sources:
  • Performance — FPS, Game Latency (pick which running game to track when more than one is detected).
  • CPU — Temperature, Load, Frequency, Voltage.
  • GPU — Temperature, Load, Frequency, Voltage.
  • Memory — RAM Load.
  • Status indicators — Recording Indicator, VPN Indicator, Live Boost Status, Background Control, and Core Director (what Live Boost is doing for the current session).
Tip: keep the HUD short. A few metrics you actually watch (for example FPS, GPU Temperature, and Live Boost Status) stay readable; a long list becomes noise.The Graph Overlay answers a different question: not “what is the value right now,” but “what just spiked.” Use it when you need to correlate a hitch, latency jump, or thermal climb with a sensor over time.
  • Open More → Graph Overlay.
  • Turn on Enable overlay, then set the hotkey (default is Ctrl+Shift+R).
  • Choose the monitor, orientation (vertical or horizontal), and where it sits on that display.
  • Pick a color preset — Default, Neon, Ember, Arctic, Stealth, or Sunset — or open Advanced customization to tune grid, graph type (area or line), y-axis, colors, animation, and graph size.
  • Set Graph data points to control how much history each chart keeps.
Graph Overlay items use the numeric sensors: CPU/GPU temperature, load, frequency, and voltage; RAM load; FPS; and Game Latency. Status-style sources (Live Boost Status, Background Control, Core Director, Recording Indicator, VPN Indicator) stay on the Game Overlay — they are not plotted as charts.Add the series you care about, label them, and reorder. For FPS or latency with multiple games running, pick which game the item tracks.Both overlays work without depending on DirectX, Vulkan, or OpenGL hooks inside a specific game. That means they can appear:
  • In fullscreen, borderless, or windowed games
  • In emulators and older titles
  • On the Windows desktop with no game running — useful while benchmarking, encoding, or watching thermals during heavy background work
  • Game Overlay — glanceable summary during play (FPS, temps, VPN / Live Boost status).
  • Graph Overlay — diagnose what went wrong (a stutter, a latency spike, a slow thermal climb).
  • Together — keep a short HUD up, then toggle the graphs when something feels off.
For deeper post-session frame analysis (frame time, comparisons, exports), use the Frame Analyzer. For automatic CPU and background optimization while you play, see Live Boost.