TrademarkTrademark
Servizi
Scopri
Azienda
IQON App
October 8·Updated October 8

Hardware Monitoring

TL;DR
Open My PC to check CPU, GPU, RAM, storage, and network readings. Watch the live graphs while using an app to see what changes when it slows down.
Open My PC and choose the component you want to check. You can also use the CPU, GPU, RAM, and storage shortcuts on Home.
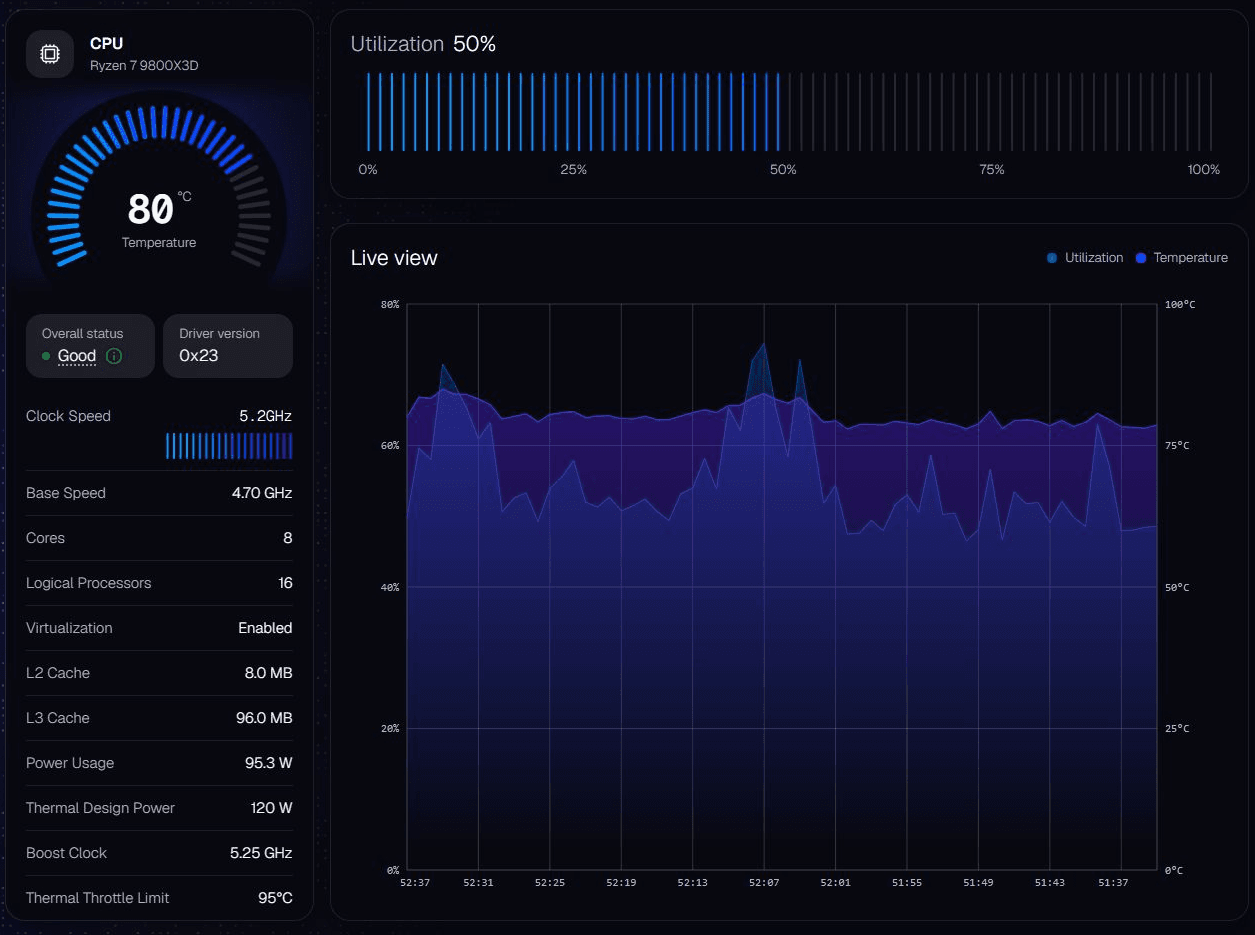
IQON native CPU page showing Ryzen 7 9800X3D temperature, utilization, clock speed, and live monitoring graph.
  • The CPU page shows temperature, utilization, clock speed, and processor details.
  • The GPU page shows temperature, utilization, clock speeds, and video memory usage. The additional sensors available depend on your hardware.
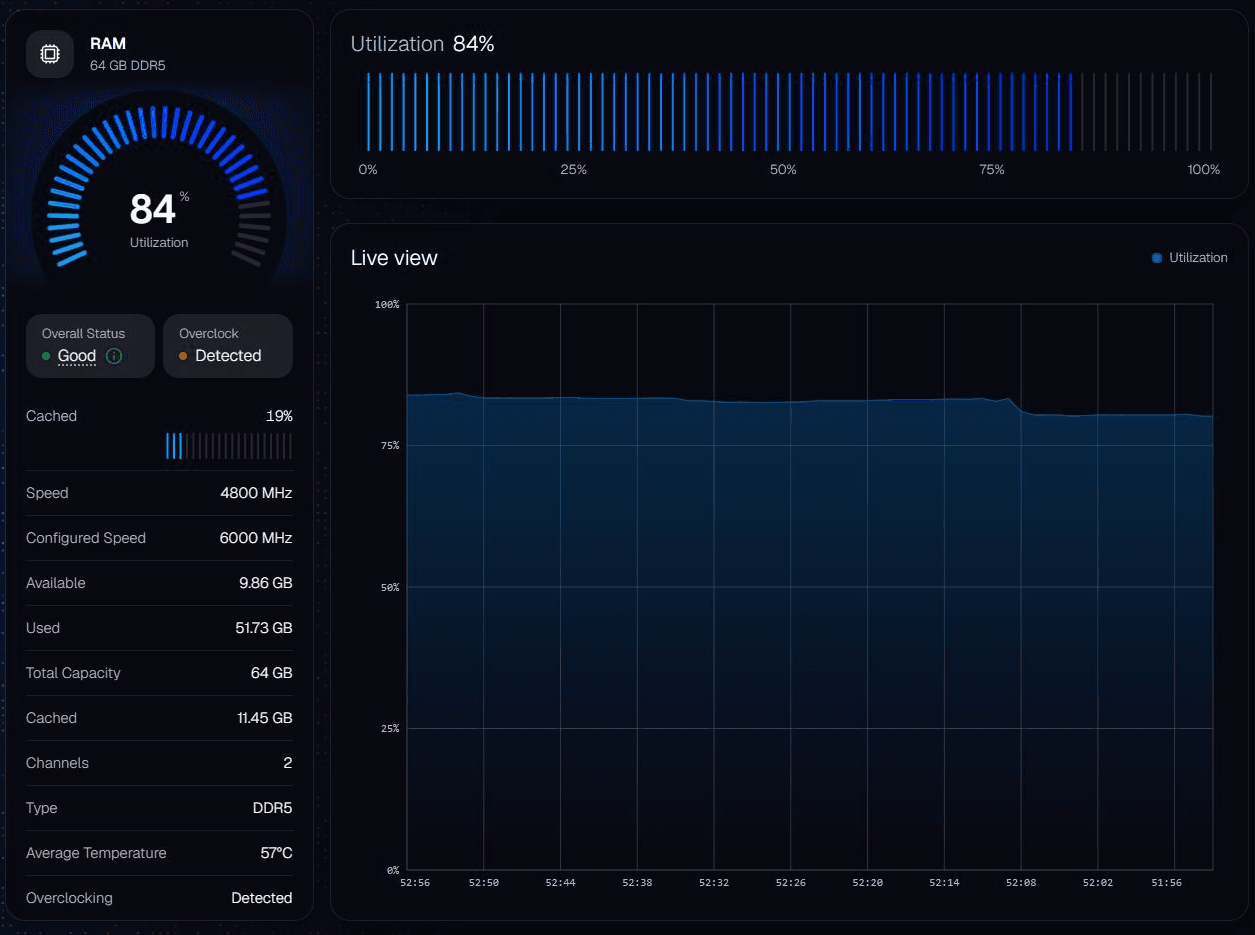
  • The RAM page shows used and available memory, total capacity, speed, and memory type.
  • The Storage page shows capacity, activity, and read and write speeds.
  • The Network page shows your current upload and download traffic. These readings are not an internet speed test.
Check the readings when your PC is idle, then repeat the task that feels slow. Watch for changes that persist while the slowdown is happening. If switching between apps feels slow, for example, open RAM and compare the "Used" and "Available" memory readings.
IQON native RAM page showing memory usage, capacity, speed, and live utilization graph.
High usage is normal during demanding tasks. To judge a temperature reading, check the guidance for your specific component. A single percentage or status label isn't enough to identify a fault. If a reading is missing or invalid, don't use it to draw conclusions about your hardware.To switch between Celsius and Fahrenheit, open Settings > Software and change "Temperature unit".Use the Frame Analyzer to record a game session, then review its frame times and sensor readings. This lets you investigate a stutter after it happens instead of trying to watch live readings while you play.To keep selected readings visible during play, see Game Overlay and Graph Overlay.